Charts in Excel

Tom Kelliher, CS 102

Feb. 23, 2001

Administrivia

Announcements

Internet search due electronically Monday. Mail to Send mail to kelliher AT DOMAIN goucher.edu.

Next project (Excel) handed out Monday.

Assignment

From Last Time

Excel Exercises.

Outline

  1. Charts.

  2. Chart links in Word documents.

  3. Quiz.

Coming Up

Next discussion on issues in computing. Any particular topics? History of computers and the Internet?

Spreadsheets

So, what's the big deal about a spreadsheet? Why are they useful?

Charts

  1. ``A picture is worth 1,000 words.''

    What is the purpose of a chart?

  2. Types of charts: bar, column, pie, line.

    Variants: ``graduated'' bar chart.

    How do you decide what chart to use?

    Examples from the budget spreadsheet.

  3. Demonstration: Chart Wizard.

    Outline of steps:

    1. Select ranges: numbers/formulas and labels.

    2. Click Chart Wizard button (looks like a column chart).

    3. Choose chart type in step 1.

    4. Add title, legends, other info in step 3.

    5. Insert into spreadsheet as object in step 4. Adjust position and size as necessary.

    Have students follow along on their PCs for actual demo. Use budget.xls.

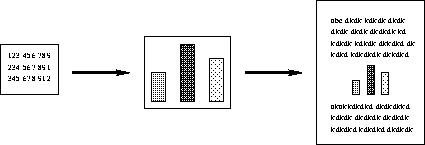
Inserting a ``Live'' Chart into a Document

The ``big'' picture:

What if the numbers change? Will we have to re-insert the updated chart?

Not if we've inserted a link! Steps:

  1. In Excel: Select chart, open Edit menu, and choose Copy.

  2. In Word: Position insertion point in document where you want chart to appear, open Edit menu, and choose Paste Special. Select radio buttons for Paste Link and Float over Text.

  3. Adjust positioning and size of chart as necessary.

Demonstrate with class, using budget.xls.


Thomas P. Kelliher
Thu Feb 22 19:39:24 EST 2001
Tom Kelliher