Midterm 3 Review, Practice
Tom Kelliher, CS14F
Nov. 12, 1996
- Return quiz.
- Extra credit due at beginning of class Thursday.
- Excel practicum will account for 30 to 40 points.
- Remainder of exam will be multiple choice, short answer.
- Bring Internet Essentials to class for working next week.
- I'll be attending a conference.
Material covered: Modules 4B--4E. Excel Essentials Projects 1
through 8.
- Spreadsheets:
- Visicalc: the first ``killer app.''
- Uses for spreadsheets. Answering ``what if'' questions.
- Charts, graphs, simple databases. Types of charts.
- Rows, columns, cells, ranges. Absolute, relative references.
Contents of cells.
- Databases:
- What is a database?
- Operations: store, organize retrieve.
- What are the two types?
- Parts: file, records, fields. Key field(s). Relating files.
- DBMS components: data definition language, data manipulation
language, query language, report generator.
- Multimedia and Presentation software:
- What are they? (Sound, text, video, images integrated together.).
- Hardware requirements.
- Multimedia software.
- Authoring software. Labor intensive. Copyright issues.
- Will it replace paper?
- Other types of software:
- Research questions.
- Integrated packages.
- Software suites.
- Personal finance.
- Graphics programs.
During the midterm, I will ask you to print two versions of the
spreadsheet: one showing values and one showing formulas. Make sure you
remember how to display formulas and how to print in landscape orientation.
The exam problem will be designed so that it is easy to do if you are
proficient at writing formulas that can be copied to other cells.
Otherwise, you will waste time typing numerous formulas.
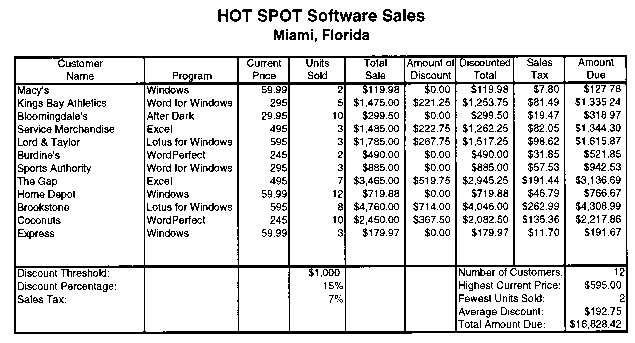
The file m2review on the R: drive contains a spreadsheet used
to determine information about software purchases for HOT SPOT Software
Sales. Here is the completed spreadsheet:

Complete the spreadsheet:
- Under cell formatting, use ``center across selection'' to center the
spreadsheet title lines (16 and 14 point bold, respectively).
- A discount is given if the total sale is equal to or greater than the
discount threshold. The discount amount is total sale multiplied by the
discount percentage. (Hint: Use an if function and absolute cell
references for discount threshold and discount percentage.)
- Again, use an absolute cell reference for the sales tax percentage.
- Use the count function to determine the number of customers.
- Use the maximum, minimum, and average functions for
Highest Current Price, Fewest Units Sold, and Average Discount,
respectively.
- Gridlines can be excluded from the spreadsheet by making the
appropriate change under Page Setup.
- The boxing effect was obtained by dragging the mouse pointer over a
selected range of cells and then using the border button on the tool bar.
(Formatting won't be emphasized on the midterm.)
- Would it be a good idea to lower the discount threshold to $500 and
lower the discount percentage to 10%? Why or why not? Why should the
discount threshold, discount percentage, and sales tax percentage be
isolated from the main body of the spreadsheet? What advantage does this
give you in working with the spreadsheet?
- Create an appropriate chart for this data.
Thomas P. Kelliher
Sun Nov 10 18:11:17 EST 1996
Tom Kelliher

